

View site analytics
Open a site and click Analyze in the section switcher at the top of the sidebar. Site overview opens first. The reports use data from Webflow Analyze.
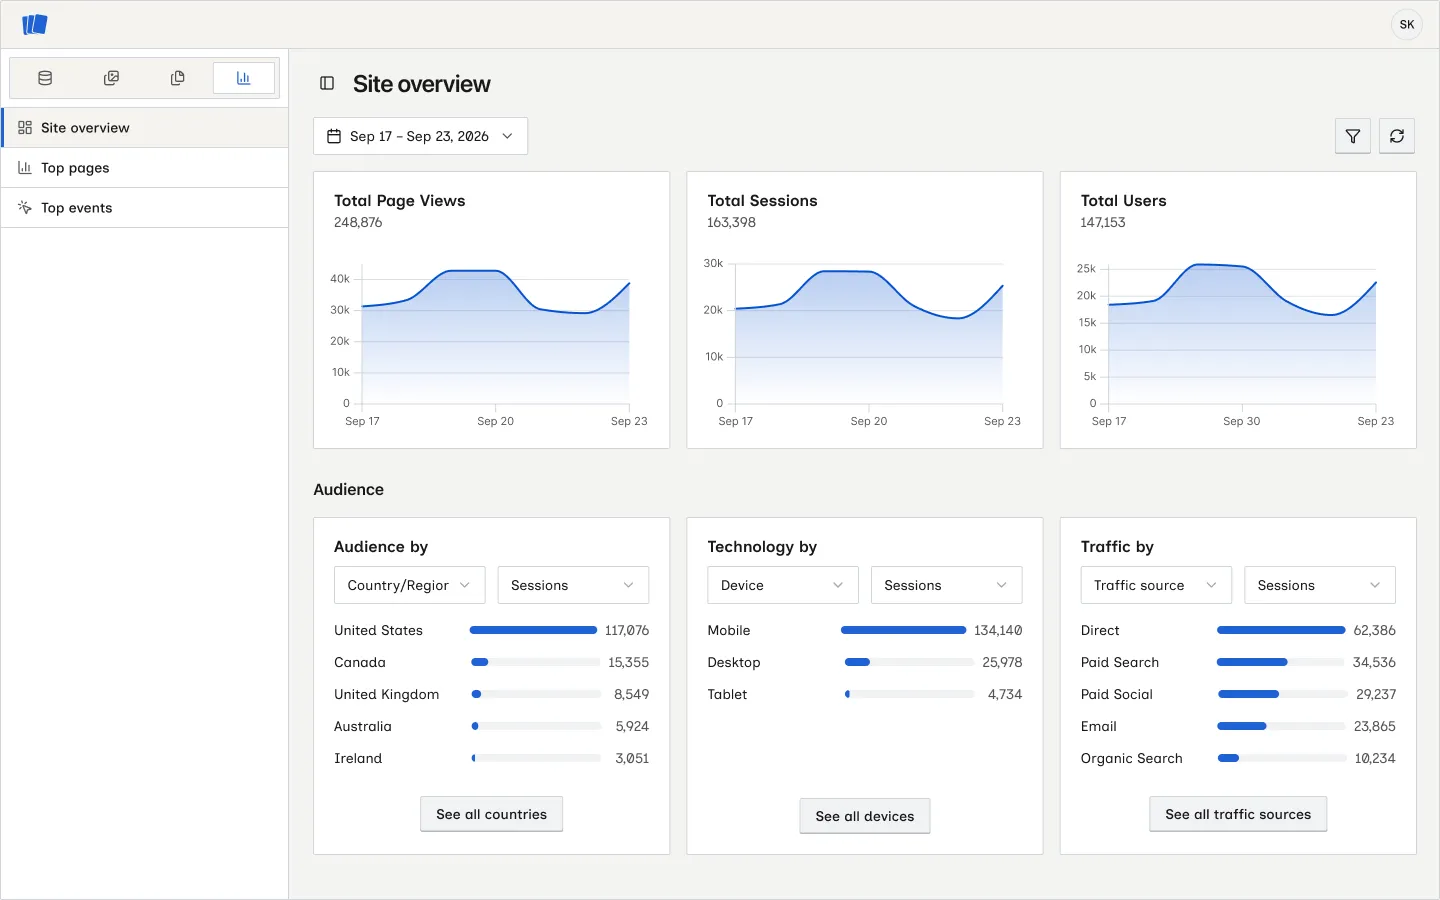
Read the site overview
The three charts show total page views, sessions, and users for the selected dates. Below them, the audience cards rank locations, devices, and traffic sources by sessions or visitors.
Use each card’s menus to change what it groups by. Audience by can show country, state or province, locale, or language. Technology by can show devices or browsers. Traffic by can show traffic sources, referral domains, or UTM values. Click the See all button below a card to open the full list.
Change the dates and filters
The date picker starts at Last 7 days. Choose a preset or set a start and end date. Dates follow the site’s time zone, and a range can span up to 100 days. The picker blocks dates before Webflow’s available history.
Click Toggle filters to filter the overview by audience, location, device, browser, traffic source, referrer, or UTM value. Add a filter, choose Is or Is not, then select a value found in the current date range. The charts and audience cards update together. Click Reload analytics to fetch fresh data.
Filters on Site overview do not carry over to Top pages or Top events. Those reports have their own device selector.
If analytics are unavailable
Webflow Analyze is a paid add-on for the Webflow workspace that owns the site. If it is not enabled, Wicked CMS shows this message instead of reports:
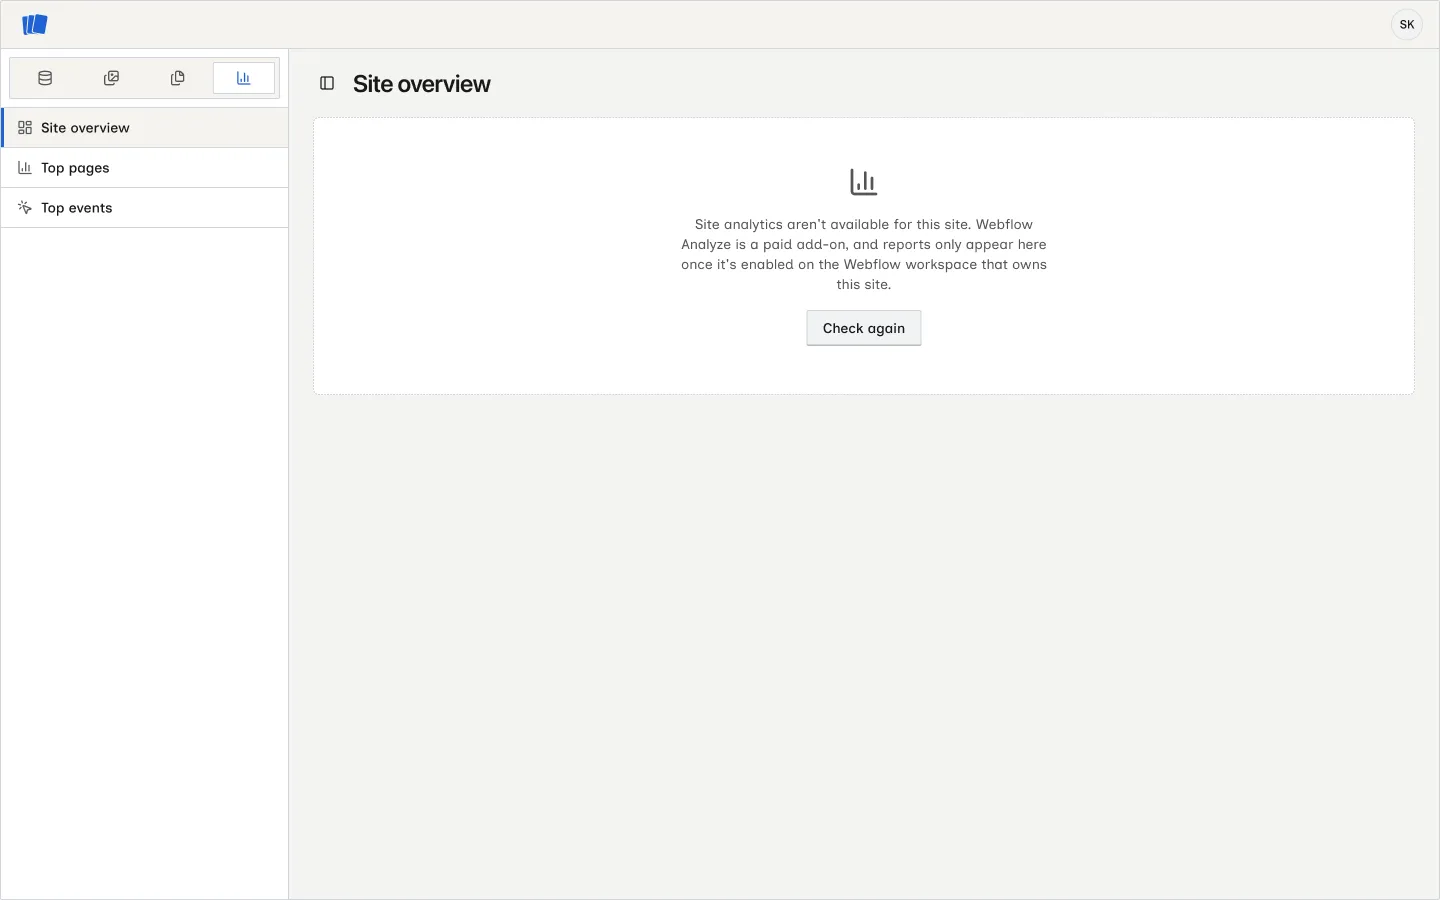
After enabling Analyze in Webflow, click Check again.